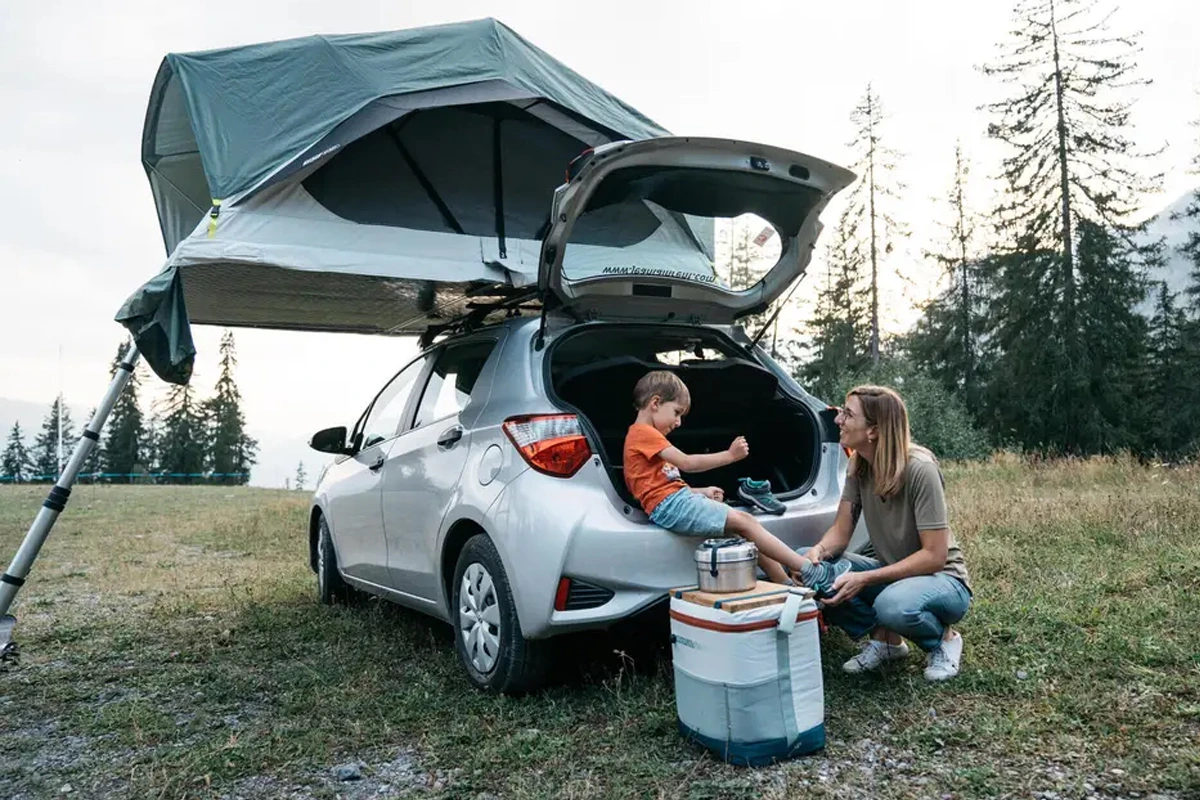
1.5M+
rooftop tents in circulation globally
Installed base of rooftop tents creates a large potential rental supply.
Investor Overview
The rooftop tent marketplace shaping how people rent, experience, and decide.
Market Context
Outdoor travel is accelerating. Rooftop tents are emerging as a flexible alternative to camper vans.
Source: Google Trends, 2016 – March 2026. Relative search interest (0–100).


A rooftop tent is a foldable sleeping system mounted on a vehicle's roof rack.
Typical characteristics:
Two main categories:
AI makes it cheaper than ever to build marketplaces, but not to build liquidity.
The real opportunity is to move early, build supply and community, and create network effects before the category consolidates.
THE PROBLEM
Rooftop tent demand is growing, but access, usage, and decision-making remain inefficient.
This creates a gap between unused rooftop tents and travelers who want to try rooftop camping. A gap few players are solving.
THE SOLUTION
Roofwander combines rentals, real-world reviews, and product discovery in one system.

MARKET POSITIONING
It combines the advantages of vans and traditional rentals, without their main constraints.
Rooftop tent travel overlaps with multiple existing travel options and can capture part of their demand depending on the use case.
THE SYSTEM
From rooftop tent supply to rentals, product discovery, and affiliate purchases.
↓
↓
↓
↓
↓
↓
↓
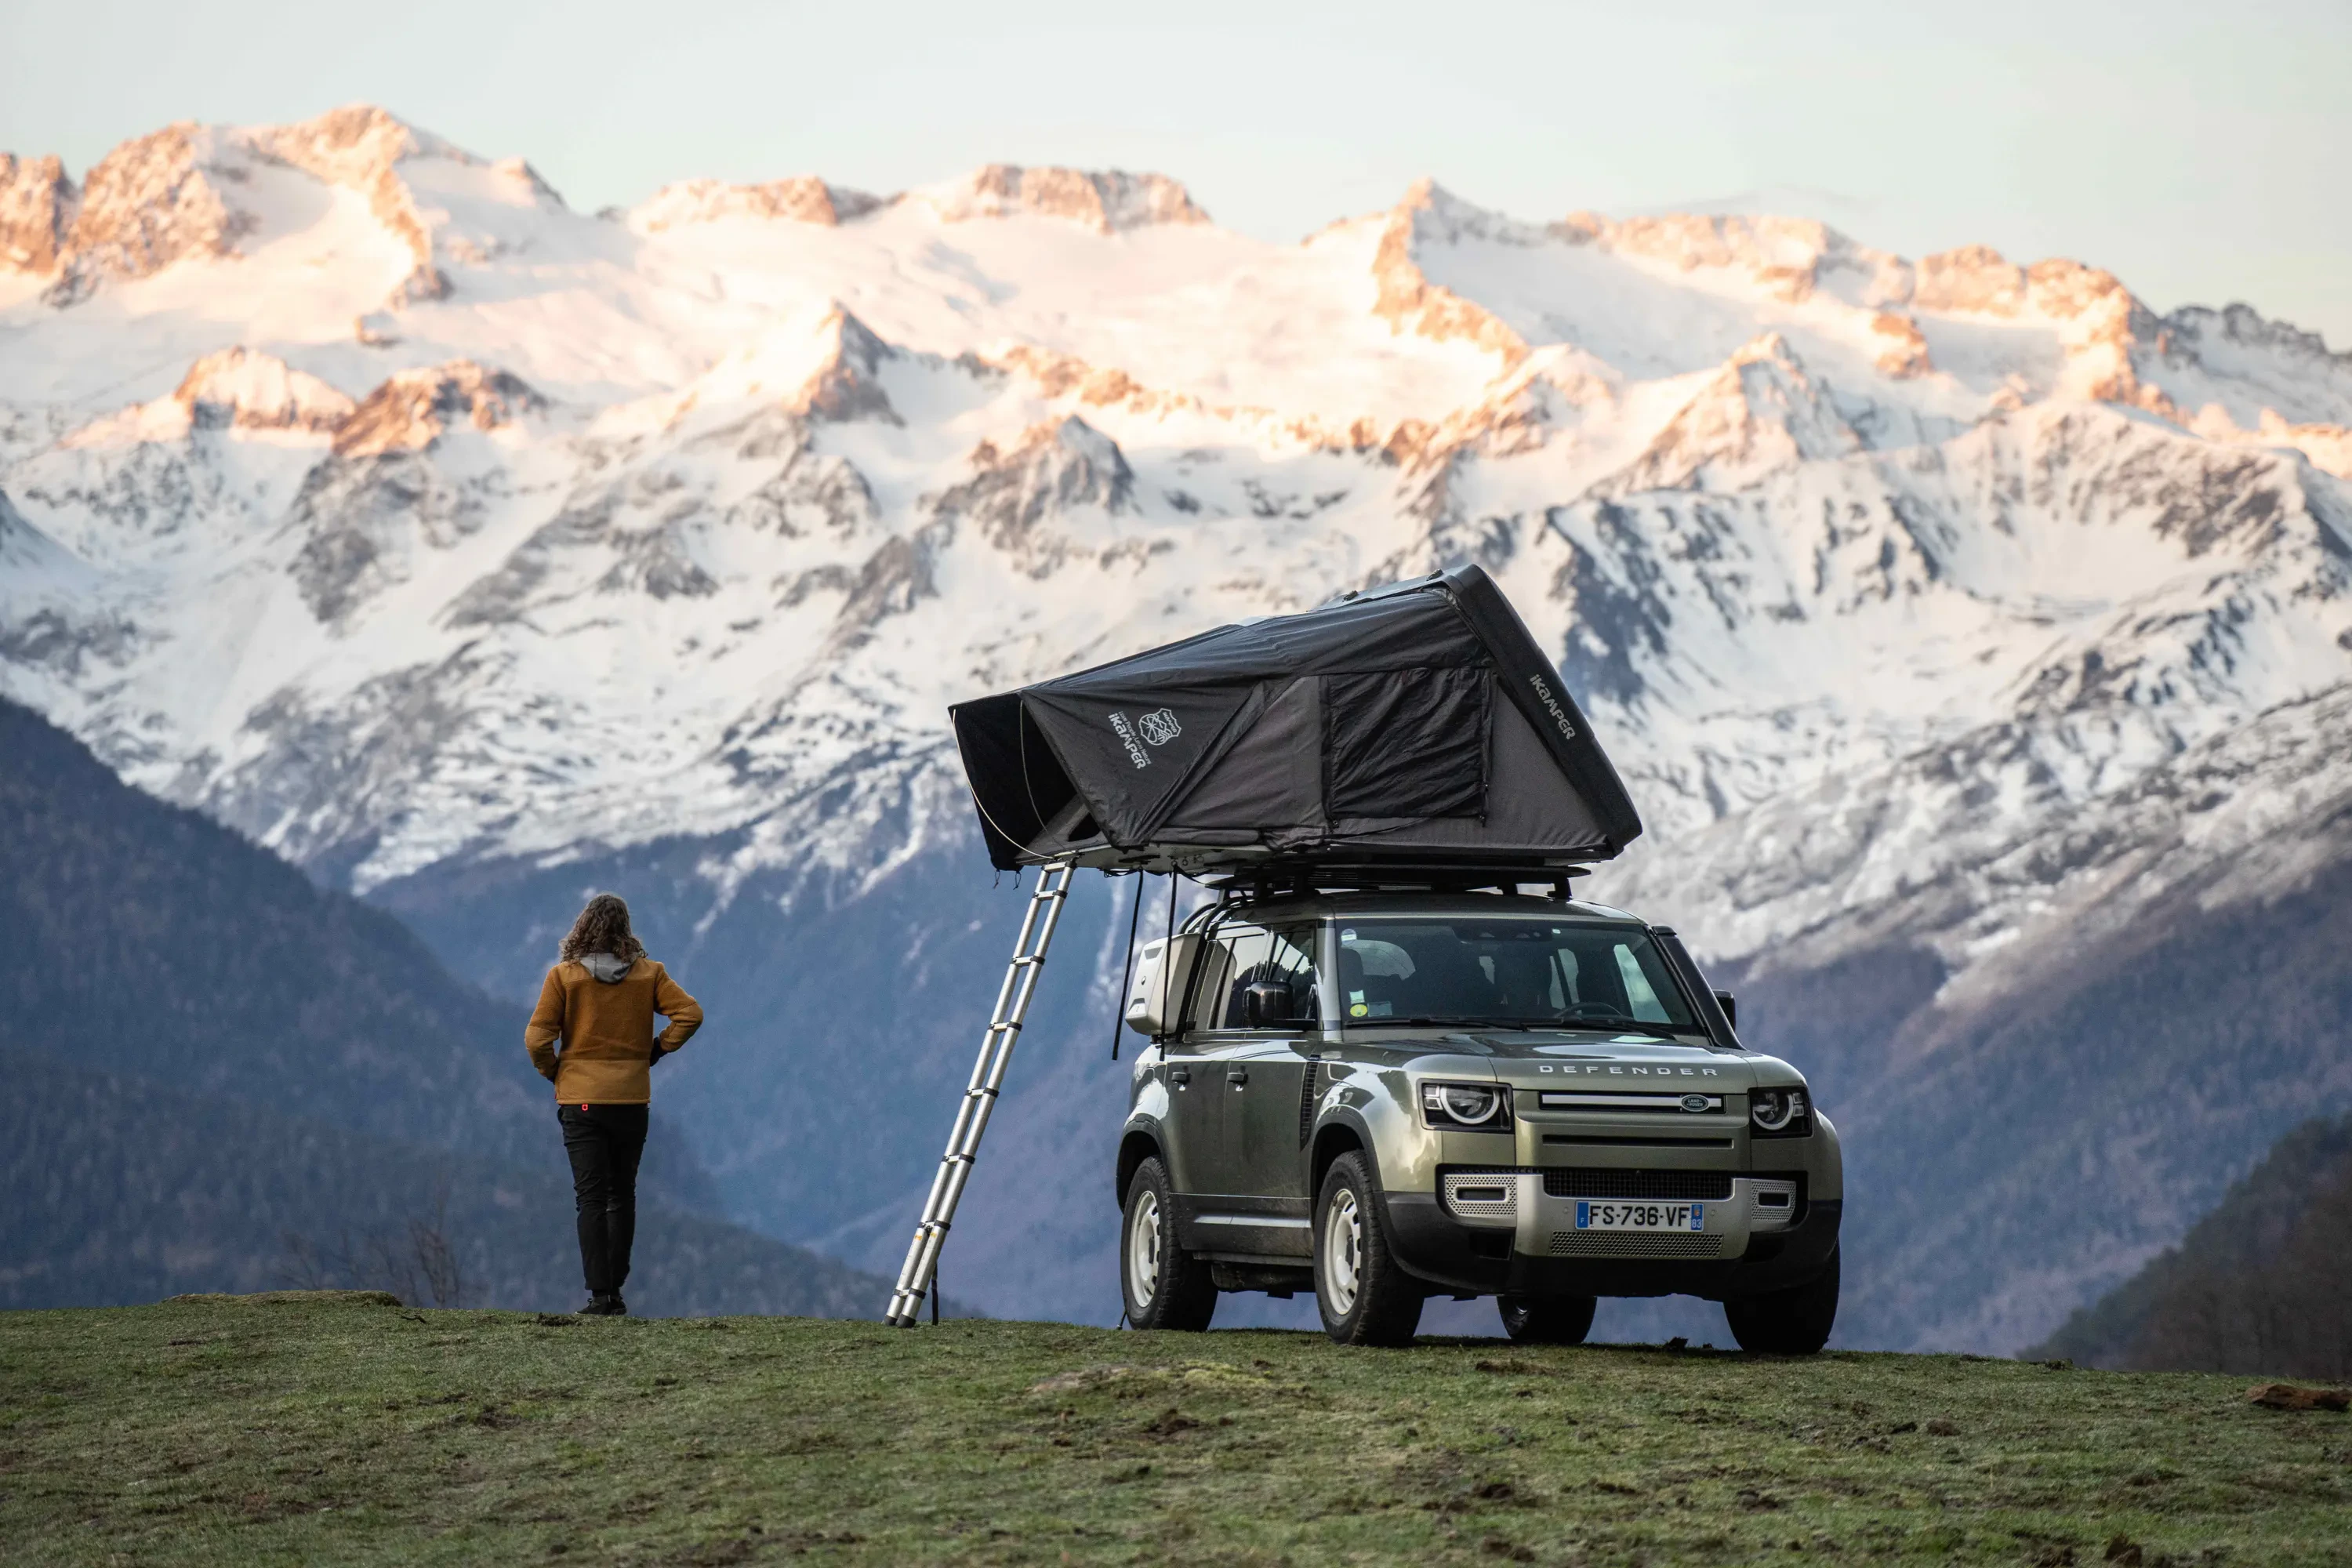
MARKET SIZE
Rooftop tents sit at the intersection of outdoor travel, road trips, and overlanding culture.
Installed base of rooftop tents creates a large potential rental supply.
Driven by outdoor travel, road trips, and overlanding culture.
Weekend explorers, road-trippers, families, and first-time campers.
A large and expanding installed base with strong consumer appeal.
Indicates strong demand for rooftop tent rentals across Europe.
29K tents sold · €2,200 avg. selling price
Sources: Cognitive Market Research (purchase market, 2024) and Google Search data (rental demand, 2024).
Roofwander launches in Europe starting with markets where rooftop tent demand and supply already exist.
Initial focus markets:
These markets combine:
Second expansion wave:
Germany represents the largest rooftop tent market in Europe and anchors the next wave across the rest of the continent.
The platform expands region by region, building supply density and local liquidity before entering new markets.
Beyond Europe, the U.S. rooftop tent market is estimated to be around 1.5× the size of Europe, creating a meaningful long-term expansion opportunity once the European model is validated.
Launch markets with existing rooftop tent demand and supply.
Scale out from Germany into adjacent European markets as local liquidity and supply density grow.
Roughly 1.5× Europe in market size, unlocked once the European model is proven.
e.g. Leboncoin, Facebook Marketplace
PRODUCT ROADMAP
MVP ready: end of April · Full version: end of the year
MVP ready: May
Rental generates cheap traffic, trust, and real usage data that we monetize above just rental and it strengthens the platform over time.
Owners publish rooftop tents with photos, pricing, and availability.
Travelers search, select dates, and pay securely through Roofwander.
The trip takes place, with deposits and reviews handled by the platform.
Payouts are released after the trip, with disputes and support managed centrally.
Simple economics:
Non-rental revenue can reach ~50% of total revenue by Year 3.
TRACTION
Roofwander is already live, with early marketplace activity and growing visibility. Early opportunity—get in before the flywheel scales.
Loading live data…
Weekly visitors by channel
Top regions (GeoIP, unique visitors)
| Country | Visitors |
|---|
Real-time user breakdown by type:
Loading live data…
Loading live data…
How we grow:
Paid acquisition
SEO
Product improvement
Closing note
The goal is not only to grow traffic, but to improve traffic quality, conversion, and marketplace efficiency over time.
Loading live channel data…
| Channel | Visitors | Views |
|---|
Weekly impressions, clicks, and CTR when Search Console is connected (daily API data rolled up by UTC week). Values in Google typically lag 1–3 days.
UNIT ECONOMICS
Both sides of the marketplace matter. We lay out our assumptions so you can stress-test them.
€200 avg booking, 15% take rate, minus ops costs. Room to grow with insurance and affiliate.
A renter books ~2x. An owner hosts ~20x. One owner supports ~10 renters.
Each booking must earn more than it costs to acquire. Current ceiling: €36/booking (renter), €4/booking (owner).
Renter acquisition
Owner acquisition
CAC allocation shifts depending on the bottleneck: supply or demand.
As liquidity and organic discovery improve, acquisition becomes cheaper and more predictable.
FINANCE
Low fixed costs. Marketing is the main lever. Revenue scales with demand.
Rental activity (core marketplace)
Monetization
| Y1 | Y2 | Y3 | |
|---|---|---|---|
| P2P bookings | 636 | 5.1k | 9.2k |
| Pro bookings | 0 | 563 | 2.3k |
| Affiliate sales (units) | 0 | 1k | 2.3k |
| Marketplace revenue (€) | €23k | €207k | €436k |
Bookings = search demand × capture rate, scaled by geographic rollout.
Capture rate: Y1 2.4% · Y2 7.3% · Y3 12.1%
Affiliate sales come from two sources:
Buy-side capture rate: Y1 0% · Y2 0.56% · Y3 1.56%
Marketing is the biggest cost. Development is in-house (time + salaries), not cash burn.
Variable-heavy: marketing and salaries drive growth; COGS and development stay lean.
| Y1 | Y2 | Y3 | Y4 | Y5 | |
|---|---|---|---|---|---|
| Cumulative Owners Acquired | 212 | 1,877 | 3,809 | 6,323 | 9,499 |
| Active Owner (year end) | 193 | 1,738 | 3,359 | 5,353 | 7,752 |
| Cumulative Travelers Acquired | 649 | 6,021 | 15,186 | 28,754 | 47,314 |
| Active Travelers (Year-End) | 384 | 3,062 | 5,741 | 8,655 | 12,105 |
| P2P bookings | 636 | 5,069 | 9,214 | 14,293 | 20,011 |
| Avg commission per Booking | €36 | €37 | €39 | €41 | €42 |
| P2P Annual Revenue | €23k | €189k | €358k | €579k | €848k |
| Pro bookings | — | 563 | 2,303 | 4,764 | 8,576 |
| Pro Avg commission | — | €32 | €34 | €36 | €37 |
| Pro Annual revenue | — | €18k | €78k | €169k | €320k |
Buy-side
| Y1 | Y2 | Y3 | Y4 | Y5 | |
|---|---|---|---|---|---|
| Rooftop Tents Sold (Units) | — | 687 | 1,507 | 3,918 | 5,734 |
| Avg Affiliate commission (tents) | — | €230 | €237 | €244 | €251 |
| Rooftop Tents Affiliate Revenue | — | €158k | €356k | €955k | €1.4M |
| Accessories Sold (Units) | — | 343 | 754 | 1,959 | 2,867 |
| Accessories Affiliate Revenue | — | €7k | €16k | €43k | €65k |
| Y1 | Y2 | Y3 | Y4 | Y5 | |
|---|---|---|---|---|---|
| Total revenue | €23k | €372k | €808k | €1.7M | €2.7M |
| Employees | 3 | 7 | 8 | 8 | 8 |
| Revenue per Employee | €7.6k | €53k | €101k | €218k | €334k |
We assume entering the U.S. market in Year 4. We share full financials on demand.
| Y1 | Y2 | Y3 | Y4 | Y5 | |
|---|---|---|---|---|---|
| P2P Revenue | €23k | €189k | €358k | €579k | €848k |
| Affiliate Revenue | — | €165k | €373k | €999k | €1.5M |
| Pro Revenue | — | €18k | €78k | €169k | €320k |
| Total Sales | €23k | €372k | €808k | €1.7M | €2.7M |
| COGS | €2k | €19k | €43k | €76k | €123k |
| Gross Margin | €21k | €353k | €766k | €1.7M | €2.6M |
| Operating Expenses | €95k | €527k | €779k | €961k | €1.2M |
| Net Income | €(74k) | €(175k) | €(13k) | €532k | €1M |
| EBITDA | €(74k) | €(175k) | €(13k) | €710k | €1.4M |
TEAM
Our team has complementary skills and a shared passion for outdoor travel.

Sebastian drives strategy, finances, SEO, and operations.

Samuele leads product development, infrastructure, and technical planning.

Lucas leads business development, partnerships, and marketing.
Disciplined execution, fast learning, and early risk testing
All founders are 100% dedicated, set weekly objectives Sunday, align every Monday, and proactively test capabilities ahead of need to understand limits early and avoid bottlenecks.
Tech ownership as a structural advantage
We own and build the marketplace features ourselves, enabling continuous data-driven UX improvement at no marginal cost, unlike competitors who outsource technology.
Clear ownership and proven founder commitment
Each founder owns a clear domain end-to-end and is accountable for outcomes, with the team working together full-time for 8 months without salaries, showing strong alignment and long-term commitment.
THE ASK
Raising a pre-seed round. Amount and terms will be available in July 2026.
Click segments for details
Salaries, customer support, part of development. Main driver of execution.
Paid marketing, events, materials. Build liquidity in core markets.
Hosting, tools, infra. Most dev is in salaries.
Legal, accounting.
No equity or debt included; cash deficit indicates required funding. Financial plan — Roofwander. For the year ended December 31.
| 2026 | 2027 | 2028 | 2029 | 2030 | |
|---|---|---|---|---|---|
| Cash at Beginning of Period | €— | €(60.6k) | €(259.3k) | €(355.2k) | €107.5k |
| Cash From Sales | 22.7k | 347.5k | 725.3k | 1,544.2k | 2,332.4k |
| Cash paid for Direct Expenses | (2.0k) | (19.0k) | (42.9k) | (76.2k) | (122.8k) |
| Cash paid for Marketing | (21.5k) | (158.8k) | (223.8k) | (272.4k) | (366.8k) |
| Cash paid for G&A | (5.0k) | (22.3k) | (48.5k) | (87.4k) | (133.7k) |
| Cash paid for Development | (8.1k) | (22.3k) | (48.5k) | (69.9k) | (80.2k) |
| Cash paid for Customer support | — | (18.6k) | (40.4k) | (87.4k) | (133.7k) |
| Cash paid for Salaries | (59.9k) | (305.1k) | (417.1k) | (444.0k) | (472.8k) |
| Cash paid for Loan Interest | — | — | — | — | — |
| Cash paid for Income Tax | — | — | — | (44.4k) | (218.3k) |
| Net Cash from Operating | €(73.8k) | €(198.6k) | €(95.9k) | €462.7k | €804.2k |
| Cash from New Investments | 15.0k | — | — | — | — |
| Cash paid for Fixed Assets | (1.8k) | — | — | — | — |
| Net Cash from Financing | €13.2k | €— | €— | €— | €— |
| Cash at End of Period | €(60.6k) | €(259.3k) | €(355.2k) | €107.5k | €911.7k |